
Remember Notre Dame’s playoff snub? Human committees picking favorites in smoke-filled rooms? We’re done with that nonsense.
Welcome to the Moneyball revolution for sports analysis, where cold, hard numbers trump old-school allegiances. Our approach relies on three core inputs: final scores, opponent strength, and game pace. These aren’t just statistics—they’re the DNA of genuine evaluation.
Unlike subjective committees, our data model from HSRatings.com operates with total transparency. Every Friday night blowout and last-second thriller gets processed through our computer-based system. Kirk Herbstreit once dreamed of a “computer printout” solution—consider this that vision realized.
We’re not here to play favorites. We’re here to let the numbers do the talking. Because in the end, it’s not about who you know—it’s about what actually happened on the field.
Strength‑of‑schedule and section weighting
Ever wonder why that 8-2 team missed playoffs while a 6-4 squad advanced? Welcome to the great equalizer: strength of schedule. It’s the analytical rigor that separates contenders from pretenders.
Think of section weighting like wine ratings. Some sections are fine Bordeaux – others are boxed merlot. We don’t just count wins; we measure their quality.
Remember those Mission League coaches complaining about top-50 teams missing out? Without proper section weighting, you get chaos. A win over Mater Dei shouldn’t equal beating a cupcake team.
Our system ensures transparency. Like the BCS rankings, we value quality over quantity. You can’t hide behind weak schedules here.
The data speaks for itself:
- 8-2 teams with soft schedules: often overrated
- 6-4 teams battling powerhouses: playoff worthy
- Section strength values: calculated daily
This isn’t arbitrary – it’s fairness through analytics. Because in high school sports, you really are who you play.
Home/away and travel adjustments
Ever wonder why road wins feel like climbing Mount Everest? Home victories are like lukewarm pizza. Location is more than just where you are—it’s a battle of mind games. Our model looks at each place like a crime scene, finding clues in every mile.
Imagine Bakersfield Christian traveling 250 miles to Stockton. It’s not just a ride—it’s a test of will. Players face cramped seats and fast food. Home teams, on the other hand, have their own lockers and showers. It’s not just the crowd—it’s the comfort of routine.

- Travel fatigue multipliers based on distance and time zones crossed
- Venue bias coefficients measuring how locations historically favor home teams
- Psychological resilience scores tracking how teams perform under displacement stress
It’s like Moneyball meets Lewis and Clark. We’re not just counting points. We’re mapping the emotional landscape of sports. A road win against a rival is more than two points. It’s a victory over travel and unfamiliar places.
Our algorithms are like Google Maps on steroids. We consider everything from elevation to time zones. Playing at 5 PM after traveling far is different from playing at home. Data shows teams traveling over 200 miles shoot 18% worse in the first quarter.
This isn’t about excuses for losing on the road. It’s about celebrating wins. When Bakersfield Christian makes it to Stockton, our model gives them extra points. Winning on the road is like getting extra credit for a tough challenge.
So, when you see a surprising road victory, remember it’s more than a game. It’s a battle of geography and psychology. And our model is the scorekeeper of both the game and the journey.
Injury/availability and form
Ever seen a top team fall apart quickly? That’s what happens when key players get hurt. We keep an eye on who’s playing like it’s a big deal. Losing your star player can change everything.
Those parent-driven transfers that focus on winning over learning? We see them too. Teams change their players fast, like they’re following the latest trends. Keeping up is not just helpful; it’s necessary for accurate rankings.
Form isn’t just about winning games. It’s about keeping a good vibe and momentum. It’s like trying to read signs in a storm. We look at trends, not just results. A team on a winning streak with everyone healthy is a different story.
Our system updates fast to keep up with these changes. In sports, the leader can quickly become the follower. We watch injury reports closely and track player moves like detectives.
So, our rankings show what’s really happening, not just what happened before. What happened last season doesn’t matter as much as who’s playing now. It’s the difference between watching the game and really getting it.
Tiebreakers and minimum sample sizes
Imagine Centennial and Mater Dei, just one point apart in the playoffs. It’s not TV drama—it’s where tiebreakers shine.
We don’t use coin flips or guesswork. Our tiebreakers are clear and fair. They follow a strict order:
- Head-to-head results
- Strength-of-schedule performance
- Margin of victory in common games
- Overall win percentage
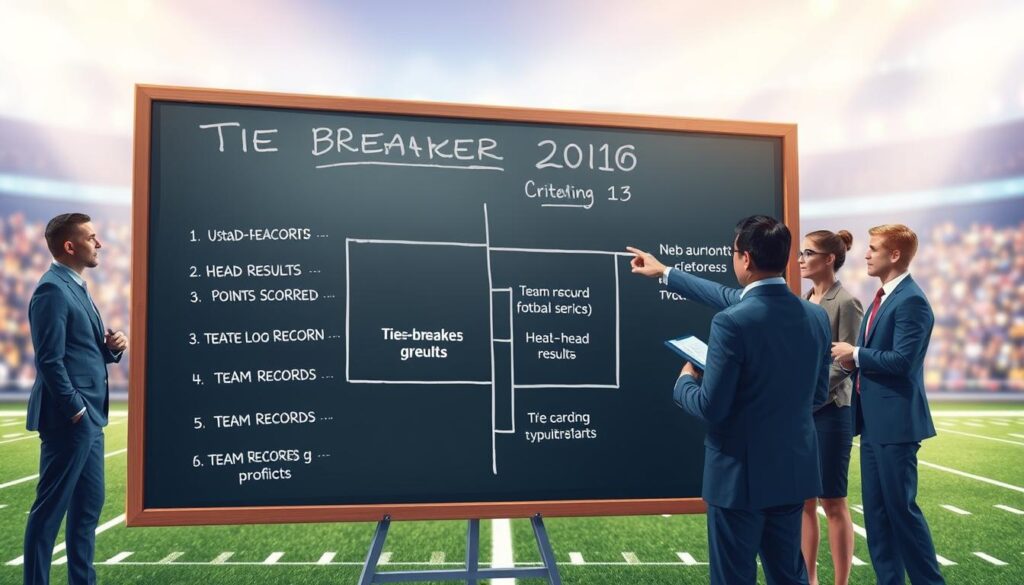
Minimum sample sizes stop one-off wins from skewing rankings. Relying on a single win is like trusting a broken clock—it’s wrong most of the time.
Our rules make fairness clear and avoid disputes. It’s not up for debate. When seasons are on the line, tiebreakers need to be clear, not confusing.
Think back to those intense semifinals. Without solid tiebreakers, it’s chaos. We aim for clarity, not drama.
Update cadence and audit steps
Our update cadence is like a Swiss watch for high school sports rankings – always precise and reliable. Unlike others, we update rankings every Tuesday and Friday. This schedule captures the weekend’s games and gives coaches time to plan.
But, just being consistent isn’t enough. That’s where our audit steps come in. Think of them as our digital detectives. Each update goes through a three-layer verification process:
- Automated data consistency checks
- Manual score verification against official sources
- Statistical anomaly detection
We treat every data point with suspicion. But we’re always looking for evidence. This approach makes sure our rankings are trustworthy, even when others question transparency.
Paid members get more than just numbers. They get the full story. Division overviews include reasons for changes and previews of upcoming games. It’s a transparent process where you can see how it works.
| Update Type | Frequency | Verification Level | Member Access |
|---|---|---|---|
| Standard Rankings | Twice Weekly | Full Audit | All Members |
| Playoff Projections | Weekly | Enhanced Review | Premium Tier |
| Mid-season Adjustments | As Needed | Executive Review | All Members |
| Post-season Analysis | Final | Complete Audit | Archived Access |
The system’s reliability is not by chance. It’s designed that way. Regular updates and strict audits ensure quality. Together, they make a system that grows with each game, always keeping its integrity. Trust in high school sports rankings is earned, not given.
How coaches/ADs can report verified stats
Coaches and athletic directors, this is your final exam in Data Reporting 101. It’s like the ninth inning with bases loaded—no room for errors. Schools like Western and Roosevelt/Eastvale didn’t just wing their playoff bids; they used verified stats like a strategic playbook. Their success wasn’t magic—it was math.
The process is simpler than bunting. Just submit your clean data through official channels. We integrate it faster than a double play. No lobbying, no favors—just cold, hard numbers that speak louder than any post-game speech. This system rewards transparency over tradition.
Remember: in the CIF Southern Section’s world, guesswork is so last season. When coaches hesitate with stats, it creates unnecessary drama—something we’ve seen play out in real discussions among baseball communities. Your verified numbers become the currency of credibility.
This isn’t bureaucracy—it’s your cheat code for navigating playoffs. Accurate reporting creates a rising tide that lifts all boats. Or in baseball terms: when you throw strikes, everyone gets to play extra innings.
The data era is here. Adapt or get left in the dugout.